| |
Learning Kinematic Models from End-Effector Trajectories
Description: This tutorial demonstrates the process of model fitting and model selection to real data recorded by a mobile manipulation robot operating various doors and drawers.Keywords: articulation models, doors, drawers, real robot, logfiles
Tutorial Level: BEGINNER
Download and Compile
All we need for this tutorial is the articulation_tutorials and its dependencies. We assume that you have already installed the basic components of ROS, checked out the ALUFR-ROS-PKG repository at Google Code.
cd ~/ros
svn co https://alufr-ros-pkg.googlecode.com/svn/trunk alufr-ros-pkg
For compilation, type
rosmake articulation_rviz_plugin
which should build (next to many other things) the RVIZ , the articulation_models and the articulation_rviz_plugin package.
To get a feeling for what articulation models are good for, please have a look at the demo launch files in the demo_fitting/launch-folder of the articulation_tutorials package. These files contain real data recorded by Advait Jain using the Cody robot in Charlie Kemp's lab at Georgia Tech. For compilation, simply type
rosmake articulation_tutorials
Visualize tracks
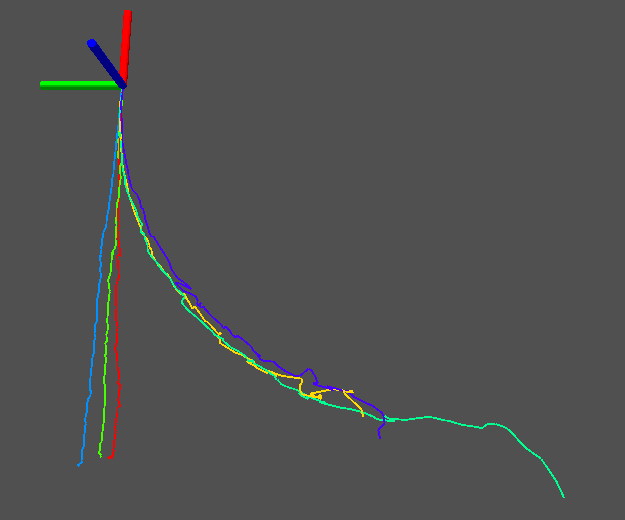
This demo will play the log files from the demo_fitting/data package using the simple_publisher.py script. The visualization plugin for RVIZ will be automatically loaded and subscribe to the articulation_msgs/TrackMsg-messages. Each trajectory is visualized in a different color.
roslaunch articulation_tutorials visualize_tracks.launch
|
Visualization of the published tracks in RVIZ using the articulation_models plugin. |
Fit, select and visualize models for tracks
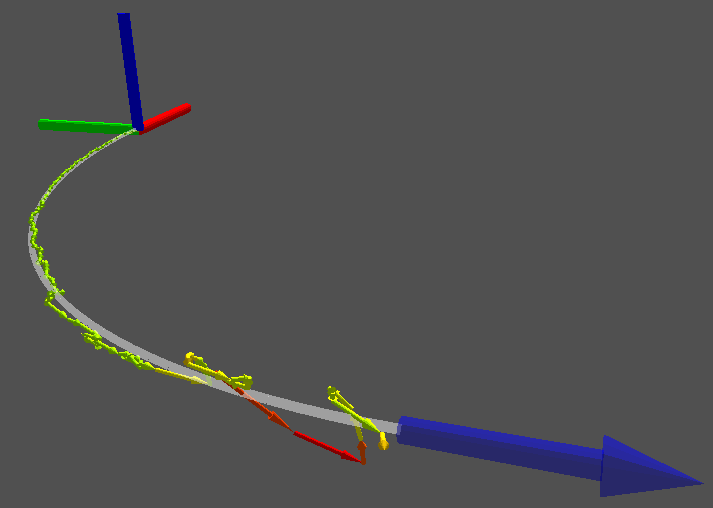
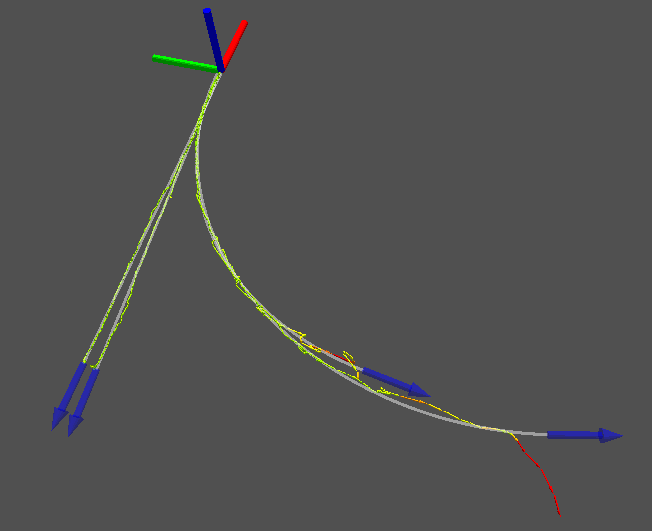
roslaunch articulation_tutorials fit_models.launch
|
Result after model fitting and selection, as visualized by the articulation_models RVIZ plugin. The white trajectory shows the ideal trajectory from the model, over its observed (latent) configuration range. The observation sequence is visualized by a trajectory of small arrows. The color indicates their likelihood: green means very likely, red means unlikely/outlier. |
|
Resulting models for 6 different trajectories. The three trajectories on the left stem from data gathered while opening a drawer, the three trajectories on the right stem from a cabinet door. |


